

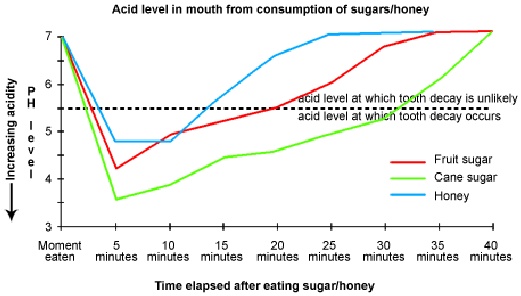
The diagram gives us information about the presence of acid in the mouth after consumption of three types of sugar. According to the diagram no acid is present when the PH level is 7. No tooth decay takes place till 5.5 PH level. As the PH level declines the acid in the mouth increases.
Within 5 minutes of consumption of all the three types of sugar the PH level falls sharply. The PH level falls the lowest after consumption of cane sugar. The PH level comes down to 3.5. After another 20 minutes the PH level comes up to 5.5 when no tooth decay can take place. It takes another 10 minutes for the PH level to come back to 7 when no acid is present in the mouth.
Least amount of acid is there after consumption of honey. The PH level comes down to a little less than 5 and then remains at this level for another 5 minutes. After another 3-4 minutes the PH level comes back to 5.5 and in another 10 minutes it is back to 7.
After 20 minutes of consumption of fruit sugar the PH level comes back to 5.5 from the level of 4 to where it had fallen.
So we can conclude by saying that least tooth decay takes place or that least amount of acid is produced after consumption of honey. The reverse is the case with cane sugar.


Leave a reply